
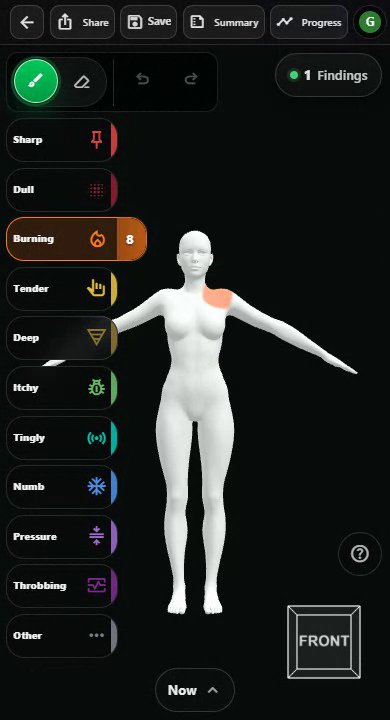
1. Show where you feel it
Paint directly on a 3D body. Turn, zoom, and pan to reach the area you want to mark.
Paint your symptoms on a 3D body and create a clearer picture of what you feel.
Free to use · No account required · Your map stays on your device
More than a number
A pain score cannot show where symptoms are, how far they spread, or what they feel like. 3DPainMap helps you capture the full picture.
How it works
Use the body as the input. The workspace turns what you mark into a visual record you can keep.
Paint directly on a 3D body. Turn, zoom, and pan to reach the area you want to mark.
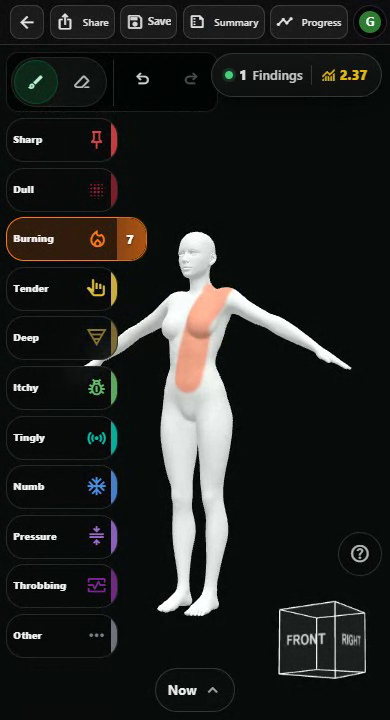
Choose an intensity and words such as dull, burning, tingling, numbness, pressure, or throbbing.
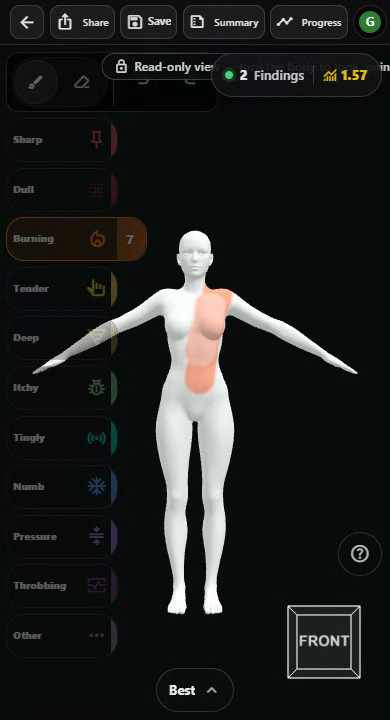
Save a visual record to revisit over time or bring into a healthcare conversation.
The surface
Turn the model and switch the overlay. Each triangle carries an anatomy assignment a person reviewed, and every stroke is recorded into texels on that same surface — which is what lets a mark be counted rather than just seen.
Loading the 3D atlas…
The 1024² paint grid a stroke is recorded into.
Over time
Pain can move, spread, shrink, fade, or feel different from one day to the next. Keep new maps over time to create a clearer record of what changed.
Use your map
Use your map to prepare for a healthcare visit, remember where symptoms were, track them over time, or show someone involved in your care.
Privacy
No account is required. There is no server-side pain record. You choose what to keep or share.
Create your first 3D pain map now. Free, private, and no account required.